The construction of the Keystone XL pipeline, planned to run from the Canadian tar sands to refineries on the Gulf of Mexico, has caused quite a stir. And now it's also led to the creation of a very detailed infographic.
Currently, thousands of protesters are conducting a two week sit-in at the White House to push President Obama to deny the permit for the oil pipeline. According to Tar Sands Action, over 300 people have been arrested to date.
On Friday, the State Department found that the pipeline would have "no significant impact" on the environment and suggested that the project move forward. Over the weekend, an interview aired of a former State Department official saying that Clinton would likely approve plans for the pipeline.
Earlier this month, an editorial in The New York Times opposed the pipeline, reading, "We have two main concerns: the risk of oil spills along the pipeline, which would traverse highly sensitive terrain, and the fact that the extraction of petroleum from the tar sands creates far more greenhouse emissions than conventional production does."
In a Tar Sands Action Press release, NASA’s Dr. James Hansen said, “If Obama chooses the dirty needle it will confirm that the President was just green-washing all along, like the other well-oiled coal-fired politicians, with no real intention of solving the addiction.” Hansen was among the protestors arrested at the White House Monday morning.
Emma Pullman of DeSmogBlog and Heather Libby of TckTckTck created a Keystone pipeline infographic, and in their statement, provided the following description:
TransCanada says their Keystone pipelines are the safest on the continent.
But what about those 12 spills in the past year? Since its operation began in June of 2010, the Keystone 1 pipeline has suffered more spills than any other 1st year pipeline in U.S. history, a track record which does not bode well for the proposed Keystone XL which tracks across one of the largest aquifers in the world – the Ogallala – which supplies drinking water to millions of mid-Westerners and provides 30% of the nation’s groundwater used for irrigation.
The Keystone pipeline map shows the spills documented in TransCanada's publicly released safety records alongside the proposed route for Keystone XL, indicating key risk areas near waterways and major metropolitan areas.
Check out the infographic below: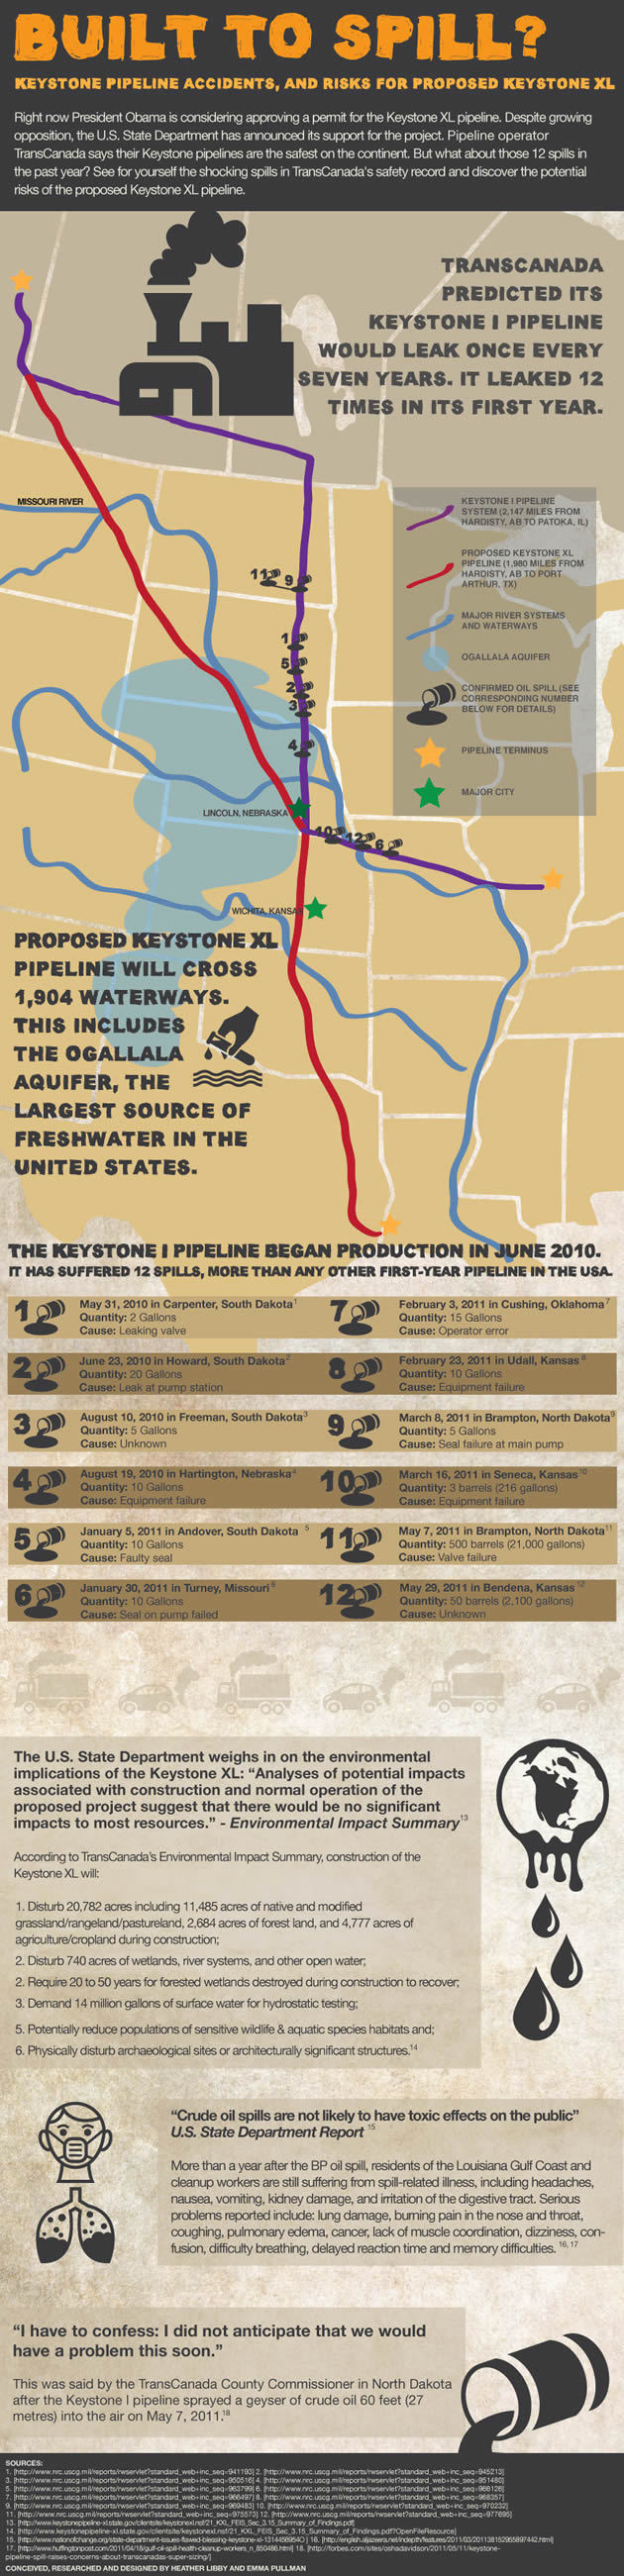
----
CORRECTION: A previous version of this infographic said spill #5 was in South Carolina. It has been corrected to indicate that the spill was in South Dakota.